24th December 2014 by Pambos Palas
Analogue to Digital Conversion [PART 2 – Sampling]
(Continuation from Part 1)
Having covered both analogue and digital signals in the previous section, the necessity of converting from one type to the other becomes evident. Digital signals are much easier to work with and process (especially from an electronic design standpoint) and offer a superior quality due to their immunity to noise. This section will focus specifically on creating a digital representation of an analogue signal via Analog to Digital Conversion (ADC).
Analog to Digital Conversion
In general, an analog to digital conversion is one where a continuous physical quantity (which is usually a voltage) is converted to a number that represents the quantity’s magnitude [1]. This could be done as a one-off in particular cases (i.e. sampling the temperature at a given time), but generally it is performed periodically to form a discretely time-varying digital signal.
Given that analog signals are continuous and have an infinite amount of possible states, it is impossible to represent them fully in a digital format. The digital signal will never be fully accurate, but will instead be an approximation made up of a series of steps. Largely, the accuracy of a digital signal is defined by two concepts: Resolution and Sampling Frequency.
Sampling Frequency
At this stage, it is important to understand that a digital signal is discreet not only in the quantized amplitude, but also in the time variation. This means that you won’t be able to know the magnitude of the signal for any arbitrary time, but will instead be limited to knowing it at the steps during which a sample was taken. As such, information is lost and the accuracy diminishes. Naturally, as the sampling rate is increased, so is the accuracy of the representation.
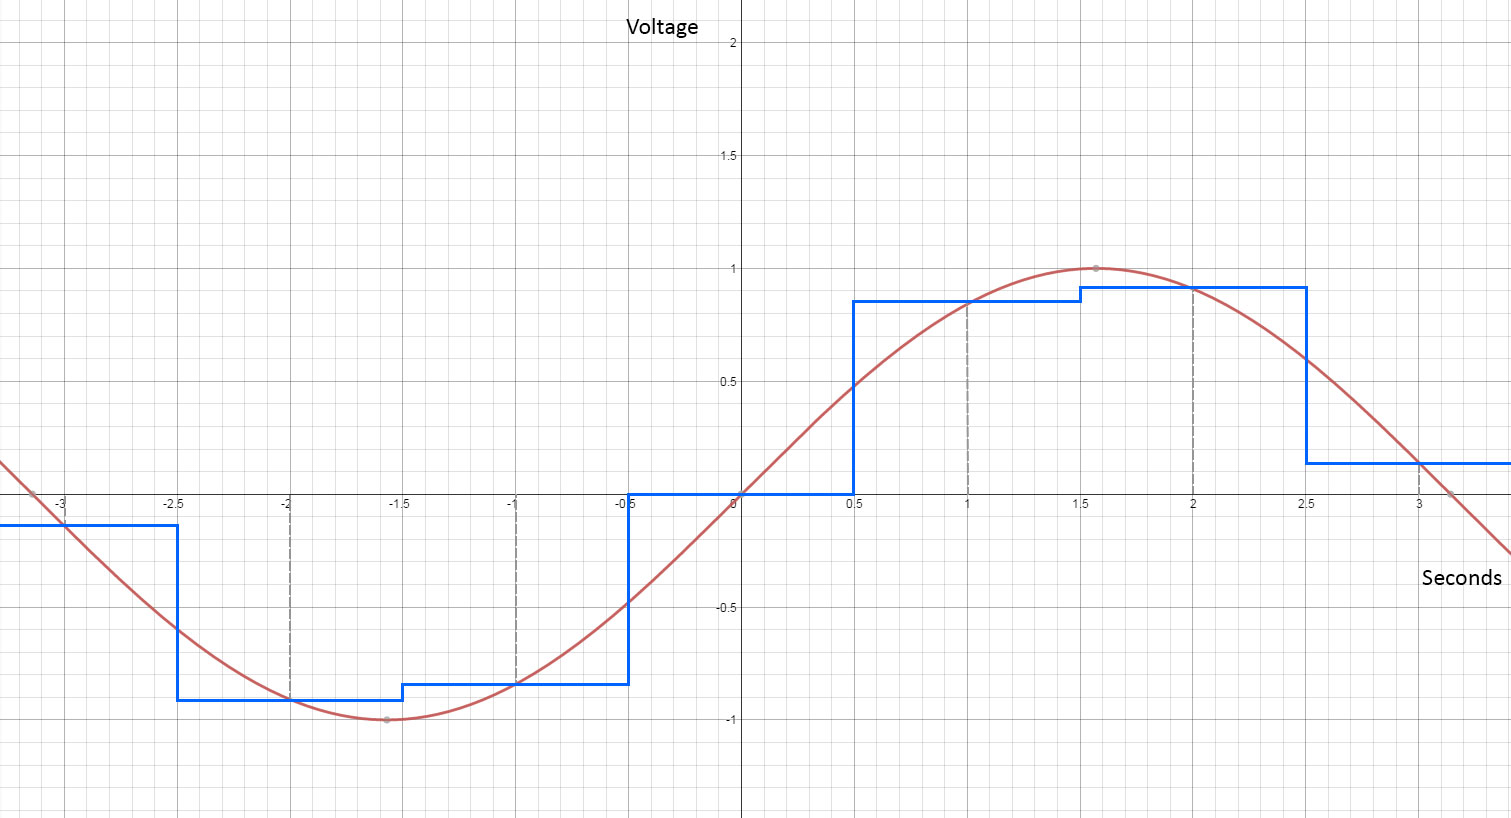
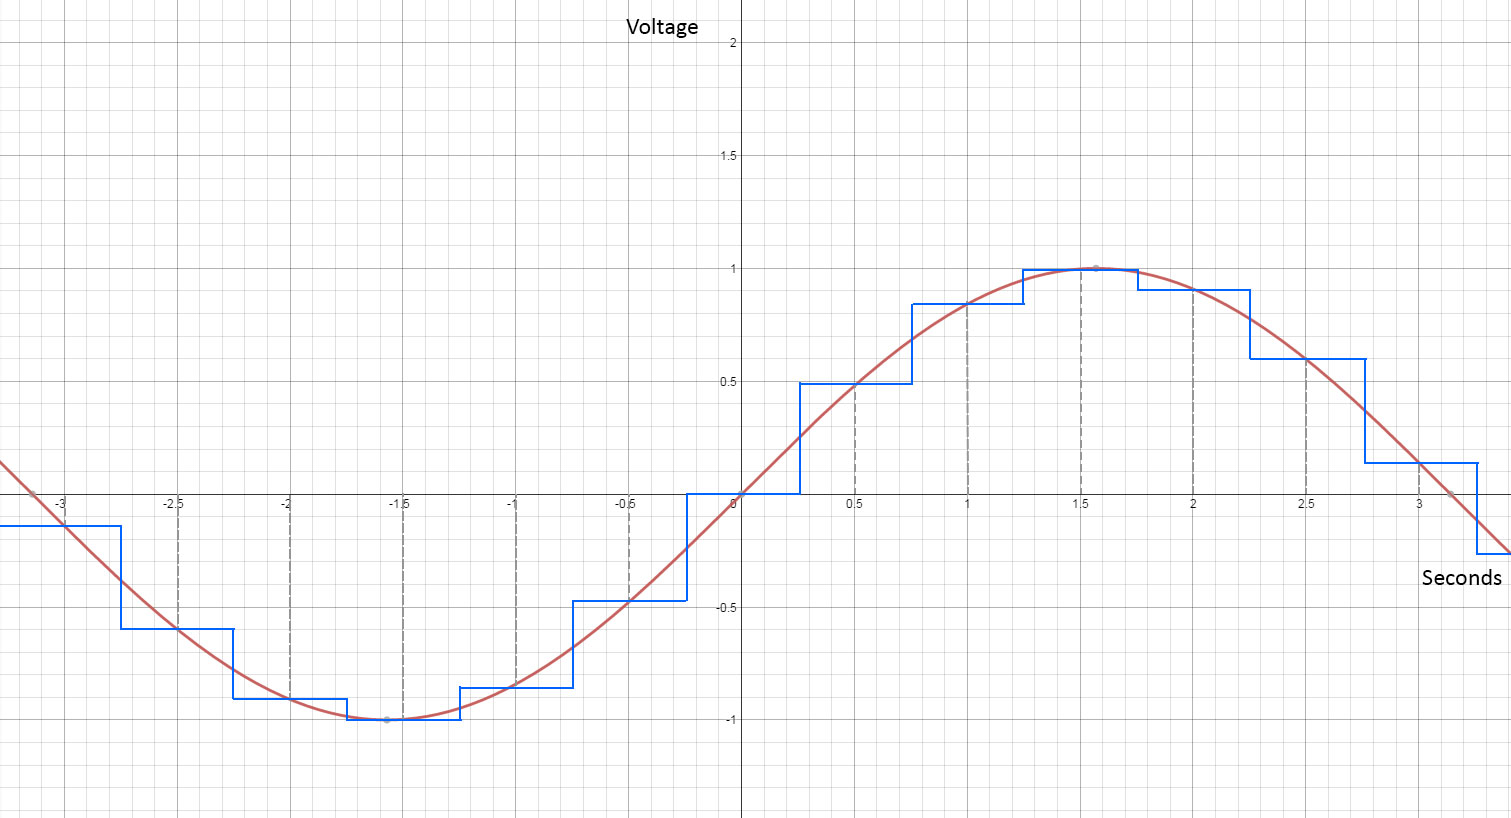
This is best illustrated with a visual example. Looking at Figure 1a and 1b, we can see an analogue sine wave that varies continuously with time (red), where at any given time we know the exact amplitude of the signal. In digitizing it however, we can see by the digital signal in Figure 1a (blue) that a great deal of information is lost. Here, samples are taking every second and the resulting approximation is quite poor, to the point that it would be difficult to recognise the signal as sinusoidal. By doubling the sampling speed, we can see in Figure 1b that the approximation is already much better – here samples are taken every half second and the wave is represented with more accuracy.
As can be seen, with a higher sampling frequency we see greater accuracy and have more information about the signal. However, there is always a compromise with sample rate and storage – by doubling the rate we are also doubling the data that is stored and required to replicate the signal. At some stage, a practical limit is also reached, where the processing power and the time required to perform a conversion (known as the conversion time) prohibits sampling any faster.
Choosing a sampling frequency depends largely on the application. In the example above, even a relatively modest sampling rate was adequate in reconstructing the sine wave. Since the frequency in question was low (1/(2*pi) = 0.1591…Hz), taking a sample at a few Hz was enough. In other cases, we may want a better quality – for example, CD audio is sampled at 44.1kHz, so 44,100 times per second. This ensures that higher frequency waves in the audio can be reconstructed. If there is a sharp sound, like the beating of a drum for example, this would have relatively high frequency components, and if the sampling rate wasn’t fast enough, these would be missed or reconstructed quite poorly. In the case of DVD audio, the frequency of sampling is even higher (96kHz), with the intention of offering a higher quality.
One thing to bear in mind however is Aliasing (covered in the next section).


