5th December 2014 by aegeuana_sjp_admin
Profiling Python Application with Graphs
Profiling Python Application with Graphs
As a General rule when we write a Python code we tend to write it as quickly as possible in order to achieve the desired outcome, once we reach this stage we look back and try to optimize the code as much as possible.
Profiling is an essential and powerful tool which allows us to get an in depth information of how the code will be executed and what it is going to do. Coupled with timing it gets more and more interesting to see what the code is doing most of the time.
You will be often surprised to discover that even a small change can affect the execution time of the code.
Prereqesuites:
Graphviz
[code language=”bash”]
apt-get install graphviz
pip install gprof2dot
[/code]
We are using a Debian distribution (wheezy/jessie).
Let’s start with a simple profiling.
Create a file called foobar.py with the following content
[code language=”python”]
import cProfile
def foo():
for x in range(100000):
print x
def bar():
for x in range(100000):
print x
def foobar():
foo(); bar();
cProfile.runctx(‘foobar()’, locals(), globals(), ‘myprofile.stats’)
[/code]
The python script is very straightforward, the goal is to divide the CPU time between two functions (foo() and bar()). The idea is to proof this is the case by runnig the profiler.
Run the foobar.py and you should see a lot of lines printing in the console, once it is finished you will have a file called ‘myprofile.stats’ created in the same directory.
Next stage would be to visualize the ‘myprofile.stats’ as a graph using the gprof2dot.
[code language=”bash”]
gprof2dot -f pstats myprofile.stats | dot -Tpng -o output.png
[/code]
You should now have a file called ‘output.png’ which looks like this:
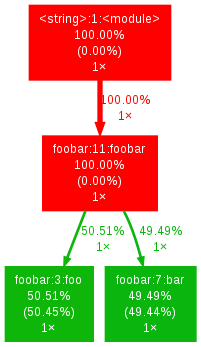
As we mentioned previously we can see what the cpu is doing and how the calls are made through this simple graph, it is much easier to spot and see the bottlenecks.
Additional links and references:
Python profiling: https://docs.python.org/2/library/profile.html
Graphviz: http://www.graphviz.org/
Gprof2Dot: https://code.google.com/p/jrfonseca/wiki/Gprof2Dot